Education's Greatest Challenge

2000 years ago our calendar looked a lot different than it does today. It actually made sense. January had 31 days, February had 30 days in leap years, 29 days the other years, March had 31 days and the months continued with the 31/30 pattern through December. Then the seventh month was named after Julius Caesar. Later Caesar Augustus also wanted a month which resulted in the month of August. However, to make Augustus completely happy he needed to have 31 days in his month just like July. So a day was plucked out of February and plunked into August. Happy Augustus. But then another problem arose – three 31s in a row could not be.
So… September was changed to 30, October changed to 31, November changed to 30 and December changed to 31.
Today we still have poems and knuckles to help us remember how many days are in each month. Some historical changes make life more complicated than necessary! I am not suggesting that the calendar be adjusted, but I will suggest some habits today’s educators have inherited that do need to be replaced. These habits are described below, as well as the simple changes that can enhance the education system. No poems or knuckles needed.
 Several years ago I surveyed 3000 teachers in my seminars asking two questions: What grade level do you teach and what percent of your students love school? The answers are displayed in what John Hattie has labelled “The Jenkins Curve.”
Hattie’s skill-will-thrill triplets can provide insight into this disappointing trend. Students begin kindergarten with the will to work hard to learn and the thrill that comes from the learning. Unfortunately, the will and the thrill for a majority of students decreases to such an extent that they no longer care about learning the skill. The responsibility of teachers becomes more and more difficult. It is nearly impossible to teach students who just do not care to learn.
The greatest challenge for today’s education is how to help students learn the skill society expects while at the same time maintaining the will and the thrill children bring with them to kindergarten.
The first step in this challenge is to identify historical habits today’s educators have inherited. Three of them are described here but certainly there are more. It is important for readers to resist blaming teachers, parents, students and the legislature. The root causes of The Jenkins Curve are older than current society.
Historical Habit #1: Data for Harm. Data that causes public embarrassment is a major cause of The Jenkins Curve. Carol Dweck wrote, “Nobody ever gets used to feeling dumb.” When bulletin boards, assemblies, and other public displays showcase who the winners and loser are, The Jenkins Curve is accelerated. Winners and losers are necessary for athletics, but education is not a game. When parents go to a football game they know there’s a 50/50 chance their child will lose. These parents do not enroll their children in school thinking there’s a 50/50 chance my son or daughter will be a loser at school. No, the parents expect 100% of the children will be successful learners. Data for Harm must be replaced by Data for Joy.
Historical Habit #2: A Forgetting System. Students are far too often evaluated on short-term memory – learn the content just long enough to remember for the exam and then forget it. It is a crazy system that evaluates students on short-term memory yet evaluates educators on the students’ long-term memory! Insane. The forgetting system must be replaced by a remembering system. What is the point of spending twelve plus years in school, if our students cannot even remember what they were taught last quarter?
Historical Habit #3: Bribery – If you , then I will . The polite term is incentives. I often ask American teachers to write down how many incentives are given per day in their school system. The average number is five, but the range is from two to twenty per day. Then this number is multiplied by the number of school days in a year and by 13 years of formal schooling. When five incentives are given per school day, students receive over 10,000 in their school career. If incentives worked, there would be no Jenkins Curve. We must replace incentives with thank you celebrations.
 The challenge presented by John Hattie is to outperform The Jenkins Curve. His learning triangle is crucial as educators think through how to best rise to this challenge. It moves from surface learning as the foundation, onto deep learning and finally capped with transfer learning. Over the years educators have become so frustrated with lack of student success and engagement with surface learning that many have shifted the focus to deep learning. This is understandable. However, the next frustration follows – deep learning assignments almost always require remembered surface learning. Students need remembered surface learning they can readily pull from their brain to succeed with deep learning assignments.
This year I partnered with a family that is home schooling their five- and seven-year-old sons. The seven year-old has used base ten blocks to add, subtract, multiply and divide with regrouping in the 1000’s place. Further he has answered square root problems including the square root of 441. He has written an ABC book of Australia and completed his My Book of Homophones where he gets to choose all of the pairs of words. What is his favourite activity? It is taking LtoJ® quizzes. Yes, quizzes. His mother has read How to Create a Perfect School with a chapter where students are requesting more quizzes. It wasn’t until her own son stated quizzes were his favourite activity each week that she finally believed this was possible. It is the power of personal bests combined with collective efficacy.
Codi Hrouda teaches grade five in Nebraska. In October of 2021 she listed five activities that occur every week in her classroom. Her students were surveyed to determine their three top enjoyable learning experiences. Twenty-one of the 24 students chose the LtoJ® quizzes in first place and three of the students had the quizzes in second place. Who would ever think that a quiz was the favorite learning activity in a classroom? Again, they love seeing they are getting smarter and learning how they contributed to the classroom total of the whole class.
Students have an emotional need to visually see they are getting smarter and a social need to know they contributed to the success of the team.
Every school needs to invest in outperforming The Jenkins Curve. Why is this so important? When the will and thrill are maintained, learning the skill is so much simpler. Think for a moment what could be accomplished if almost every high school student still had their kindergarten will and thrill in place. In order to accomplish this feat, students must be highly engaged with surface learning, experiencing exciting/challenging deep learning and regularly being a part of sharing transfer learning observations with classmates.
The LtoJ® process, described in How to Create a Perfect School, is one way to use surface learning data for joy, take away short-term memory evaluation and remove the need for bribes. Students pressure the teacher to teach more instead of the teacher pressuring the students to learn more. LtoJ® impacts all grade levels and all subjects.
The second step is replacing the historical habits described in step #1. Here goes…
 1 Provide students the first week of school a list of the surface learning key concepts for the school Eliminate all trivia and all duplicates from prior grade levels.
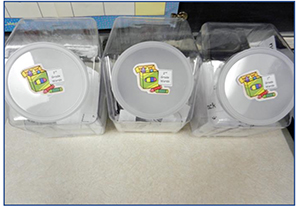
2 Quiz students seven times each quarter on a random sample from the The sample size is the approximate square root of the number on total list. For example, if there are 70 items on the list, ask eight questions per quiz. The hamster ball in the photo is used to randomly select items for the quiz. After each non-graded quiz, the selected items are returned to the hamster ball because any item from the key concept list can appear on any quiz.
3 Download from LBellJ.com, under free resources, the blank graphs corresponding to the number of questions on each quiz.
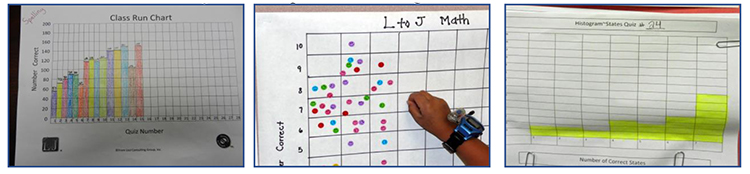
4 Each student has three jobs: graph how many correct on the downloaded student run chart, (2) highlight on the key concept list any item answered correctly on the quiz, and (3) designate number correct on an anonymous data collector for the whole class.
 5 All graphs that go on the wall are for the class as a whole – not for individual They are the class run chart (a total correct for whole class), scatter diagram (used for effect size calculation each quarter), and histogram (shows progression from L curve onto bell curve and hopefully a J curve at year’s end). I suggest that no class time be utilized for these graphs – two students are assigned to create each of them when they have completed class assignments.
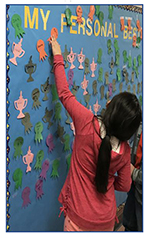 6 Celebrate individual All-Time Bests (ATB). When students score higher than ever before it is vital that their improvement is recognized, even if the improvement is just by one point. This celebration is as simple as writing name on a shape and posting it on the wall. A quick high-ten with the teacher works very well with older students or even a simple star sticker on their graph over their highest score.
7 Celebrate classroom ATBs with a quick fun activity. There is no need to give anything to the students; the aim is to create fun memories. This works at all grade levels but obviously what is considered fun in elementary school is different from what is fun in high school. Some teachers play a fun song, others do a dance or allow for the class to do a cheer. The celebration does not have to be a big thing, but it needs to happen to remind students of how much they are learning.
8 Every quarter two students enter the data from the scatter diagram into the effect size calculator to see their effect size thus far. (The effect size calculator is free from [email protected] – a google doc.)
9 Watch for students with seven perfect quizzes in a row. When this happens they are accelerated to the next level or given time to enrich learning with a major interest.
10 Start over the next year with two adjustments: (1) revise the key concept list as teachers always think of ways to improve it and (2) tell students highest score from prior year as a challenge to outperform it.
The LtoJ® process does replace data for harm with data for joy and it does take away the possibility to cram and forget because students do not know what questions will randomly be on the quiz. Further, there is no need to bribe students to learn; they want the teacher to help them earn All-Time Bests. Schools can be very engaged with surface learning and thus learn the expected skill without destroying their will and thrill! We can guide students to learn the skill society expects and at the same time maintain the will and thrill students bring with them to kindergarten. The amazing result from 20 years teaching the LtoJ® process is that classroom time for surface learning is lessened and thus more time is allocated for deep learning. Such a deal! More time for deep learning with students who love how they gained/remembered the surface learning knowledge.
In the same survey that gave me the data for The Jenkins Curve I also asked what percent of the school year was spent teaching students content they should already know. The average was 33% of the year. The LtoJ® process removes much of this wasted review time. When schools become experienced with this process teachers have the key concepts for their grade level and for all prior grade levels. Here is a picture of spelling as an example. The quiz for spelling in this third grade room is sixteen grade three words, three grade two words and one grade one word. Students know that the learning from the prior grade levels is not going away. Thus, as the beginning of the school year almost no time is spent on review of prior grade levels. New learning starts immediately, but on the quizzes items are included from prior grade levels. The review is on- going, not a boring start of the year. The math fluency quizzes and math standards quizzes on the LBellJ.com website demonstrate this structure.
The greatest challenge facing education to maintain will and thrill while gaining required skills. The Jenkins Curve has the potential to alter history in an incredibly positive way if teachers and administrators begin making necessary improvements to their current agendas. Now is the time to exterminate poor education techniques and to take a chance on a whole new way of thinking. Our students cannot afford to wait any longer for the teachers and adults in their lives to “figure it out.” We need real change and a real solution. LtoJ® offers that so and so much more to all who are responsible for the education and wellbeing of young people. If the Romans can get creative enough to change an entire calendar for the world, we should be able to change the education system to actually work in the favor of those who are in the classrooms.
Lee Jenkins is author of How to Create a Perfect School and Optimize Your School. He resides in Scottsdale, Arizona, USA. His website is www.LtoJ.net and email address is [email protected]. He works full-time as an author, speaker and consultant with his firm LtoJ Consulting Group.